

What is leverage in real estate — and why does the same tool that builds generational wealth for disciplined investors destroy capital for undisciplined ones? Leverage is the use of borrowed capital to control a larger asset than your equity alone would allow, amplifying both the upside and the downside of every investment decision. In real estate, leverage is most commonly expressed through the loan-to-value (LTV) ratio — and understanding how it affects your actual equity returns, in dollars and percentages, is one of the most important analytical skills a real estate investor can develop.
This guide goes beyond the definitions. It shows you the math.
What Is Leverage in Real Estate?
Leverage in real estate is the use of debt financing to purchase a property worth more than the equity you have invested — multiplying the return on your equity when the asset performs, and multiplying the loss when it does not.
Consider a simple example. If you buy a $1,000,000 property with $1,000,000 in cash and sell it for $1,200,000, you earned $200,000 on a $1,000,000 investment — a 20% return. If instead you put $350,000 of your own capital into that same deal and borrowed the remaining $650,000, you earned $200,000 on a $350,000 investment — a 57% return on equity, before debt service.
That amplification is the power of leverage. The risk is the mirror image: if the property sells for $900,000 instead, the all-cash investor loses $100,000 on $1,000,000 deployed (10% loss). The levered investor loses $100,000 on $350,000 deployed — a 29% loss of equity, with the lender’s principal intact.
Leverage is not inherently good or bad. It is a tool whose impact depends entirely on how it is structured, at what cost, and in what market environment.
Loan-to-Value (LTV): The Primary Measure of Leverage
Loan-to-Value (LTV) is the ratio of the loan amount to the appraised value or purchase price of the property — expressed as a percentage.
LTV = Loan Amount ÷ Property Value
If a property is purchased for $2,000,000 with a $1,400,000 loan, the LTV is 70%. This means the lender has financed 70% of the asset, and the borrower’s equity covers the remaining 30%.
LTV matters because it determines:
- How much equity the borrower must contribute
- The lender’s margin of safety (how far values must fall before the loan is “underwater”)
- The interest rate the lender charges (lower LTV = lower risk = lower rate)
- Whether the property qualifies for agency financing (Fannie Mae and Freddie Mac typically cap at 75–80% LTV for multifamily)
Typical LTV ranges by loan type:
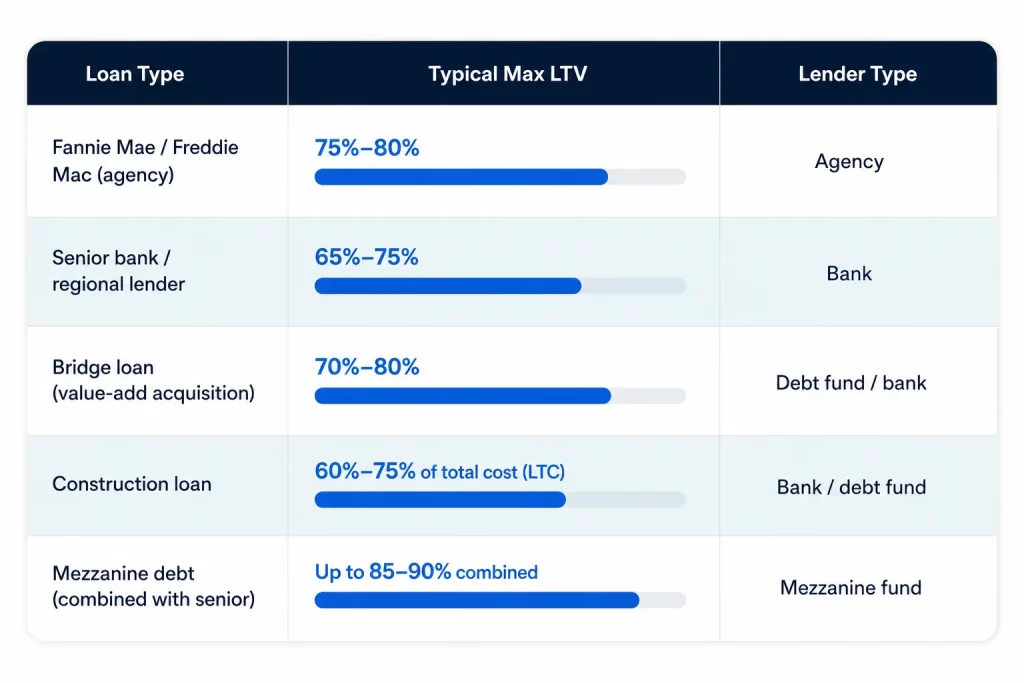
For development and value-add acquisitions where the purchase price doesn’t reflect stabilized value, lenders often use Loan-to-Cost (LTC) instead of LTV — measuring the loan against total project cost rather than appraised value. For a deeper look at LTC, see our guide to LTC Explained: How Loan-to-Cost Ratio Shapes Deals.
The Math of Leverage: A Worked Example
To understand how leverage affects equity returns, let’s run two scenarios on the same $2,000,000 multifamily acquisition generating $130,000 in annual NOI (a 6.5% cap rate):
Scenario A: All-Cash Purchase
| Metric | Value |
|---|---|
| Purchase Price | $2,000,000 |
| Equity Invested | $2,000,000 |
| Annual NOI | $130,000 |
| Annual Debt Service | $0 |
| Net Cash Flow | $130,000 |
| Cash-on-Cash Return | 6.5% |
| Unlevered IRR (5-yr, 10% NOI growth, 6.0% exit cap) | ~9.5% |
Scenario B: 65% LTV at 6.0% Interest (Interest-Only)
| Metric | Value |
|---|---|
| Purchase Price | $2,000,000 |
| Loan (65% LTV) | $1,300,000 |
| Equity Invested | $700,000 |
| Annual NOI | $130,000 |
| Annual Debt Service (interest-only) | $78,000 |
| Net Cash Flow after Debt Service | $52,000 |
| Cash-on-Cash Return on Equity | 7.4% |
| Levered IRR (5-yr, same assumptions) | ~15.2% |
Why does leveraged IRR jump from ~9.5% to ~15.2%? Because the equity investor controls a $2,000,000 asset while only deploying $700,000 of their own capital. When the property appreciates — whether through forced value-add execution or cap rate compression — that appreciation is realized on the full $2,000,000 of asset value, but the gain is credited to the $700,000 of equity. The lender’s return is fixed at 6.0%; everything above that accrues to equity.
This is why leverage, used conservatively, is one of the most powerful return-enhancement tools in real estate.
Positive Leverage vs. Negative Leverage
Not all leverage amplifies returns upward. Whether leverage helps or hurts your equity returns depends entirely on one relationship: the spread between the cap rate and the interest rate on the debt.
Positive leverage: Cap rate > Interest rate → debt amplifies equity returns Negative leverage: Cap rate < Interest rate → debt erodes equity returns
Positive Leverage Example:
- Property cap rate: 6.5%
- Interest rate on loan: 6.0%
- Positive spread: +50 basis points
- Effect: levered cash-on-cash return exceeds unlevered cap rate
Negative Leverage Example:
- Property cap rate: 5.5%
- Interest rate on loan: 7.0%
- Negative spread: -150 basis points
- Effect: every dollar of debt reduces the equity investor’s cash-on-cash return below the unlevered cap rate
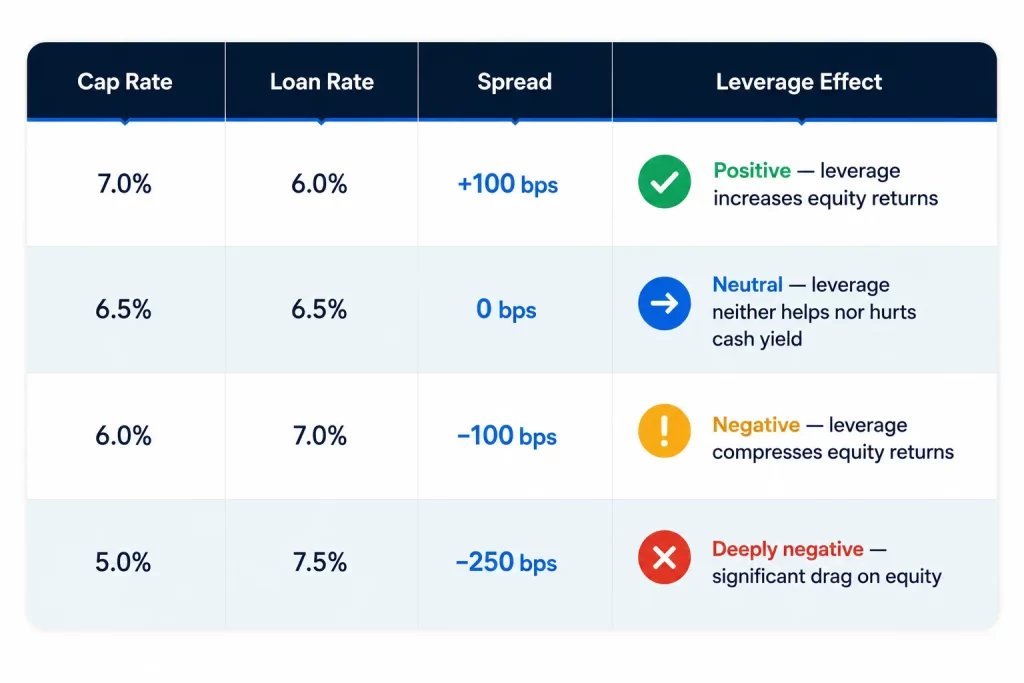
The 2022–2024 interest rate cycle drove most U.S. real estate markets into negative leverage territory — a significant driver of the transaction volume collapse during that period. Properties that were acquired with 65% LTV at 3.5% interest in 2020–2021 faced dramatically different economics when refinancing came due at 6.5%–7.5% rates.
This is not a reason to avoid leverage. It is a reason to underwrite to current interest rates rather than projecting rates will return to prior lows — and to structure deals with enough NOI cushion to withstand rate stress.
Debt Service Coverage Ratio (DSCR): Measuring the Margin of Safety
Alongside LTV, the Debt Service Coverage Ratio (DSCR) is the most important leverage metric in real estate underwriting.
DSCR = Net Operating Income ÷ Annual Debt Service
DSCR measures how many times the property’s income covers its debt obligations. A DSCR of 1.25x means the property generates 25% more NOI than is required to service the debt — providing a buffer against income decline.
| DSCR | Interpretation |
|---|---|
| Below 1.0x | NOI insufficient to cover debt — property is losing money before equity returns |
| 1.0x | Breakeven — every dollar of NOI goes to debt service |
| 1.10x–1.20x | Thin cushion — one vacancy spike or expense surprise hits equity |
| 1.25x–1.35x | Healthy — standard institutional minimum; provides meaningful buffer |
| 1.40x+ | Conservative — strong buffer against income volatility |
Most agency lenders (Fannie Mae, Freddie Mac) require a minimum DSCR of 1.25x at underwriting. Bridge lenders typically require 1.10x–1.20x on current NOI, with a path to 1.25x+ at stabilization.
DSCR applied to our worked example:
Using the same $2,000,000 property with $130,000 NOI and a $1,300,000 loan at 6.0% interest (interest-only):
- Annual debt service: $78,000
- DSCR: $130,000 ÷ $78,000 = 1.67x
This is a strong DSCR — the property generates 67% more income than needed to service the debt. If NOI fell by 35%, the property would still break even on debt coverage. That is meaningful downside protection.
Now shift the interest rate to 7.5% (as many bridge borrowers faced in 2023–2024):
- Annual debt service: $97,500
- DSCR: $130,000 ÷ $97,500 = 1.33x
Still acceptable — but the margin has compressed. A further NOI decline of 25% would push the deal to a 1.0x DSCR. This is why underwriting to current rates, not assumed future rates, is non-negotiable for disciplined operators.
Where Leverage Goes Wrong: The Over-Levered Deal
Leverage fails when it is sized against optimistic assumptions rather than conservative ones. The most common mistakes:
Stacking too much debt. Combined LTV above 80–85% (senior + mezzanine) leaves almost no equity cushion. A 15% property value decline wipes out the equity investor entirely — and may leave the lender undersecured.
Floating-rate debt without a rate cap. Bridge loans are floating-rate. A borrower who underwrote a deal at 4.5% all-in and refinanced at 7.5% two years later — without an interest rate cap in place — experienced a 3.0% increase in debt cost on every dollar of leverage. On a $10M loan, that is $300,000 per year in additional cost, potentially turning a cash-flowing asset into a cash drain.
Projecting exit cap rate compression. Many sponsors underwrote 2020–2021 acquisitions assuming the exit cap rate would remain at or below the entry cap rate. When cap rates expanded 75–150 basis points between 2022 and 2024, levered deals that relied on cap rate compression for returns saw equity values decline sharply — while the debt remained at face value.
Refinancing risk. Short-term bridge debt must be replaced. If the property hasn’t stabilized on schedule, or if the lending market tightens, extension options can come at punishing costs — further compressing returns for equity investors. Understanding how much time a business plan needs, and how much cushion exists if the timeline slips, is a core part of leverage risk management.
How Northwind Approaches Leverage
At Northwind Investment Group, our underwriting philosophy treats leverage as a precision tool — not a return accelerant to be maximized.
We target 60%–70% LTV on senior debt for our Class B multifamily acquisitions. This range provides meaningful amplification of equity returns while maintaining a real equity cushion against value declines.
We require a minimum 1.30x DSCR at acquisition — underwritten to current interest rates, not projected future rates. We stress-test every deal for scenarios where rates rise 100 basis points from our entry rate, and we will not acquire an asset whose DSCR falls below 1.15x in that scenario.
We use agency or bridge debt only — no mezzanine stacking. Adding mezzanine debt above senior financing increases combined leverage to 80–90%, reduces the equity cushion, and introduces a subordinate lender with UCC foreclosure rights that can move far faster than a traditional mortgage process. We believe the simplest capital structures are the most resilient.
We underwrite to conservative exit cap rates. Our standard assumption is that exit cap rates will be equal to or higher than entry cap rates — never lower. This means our projected returns do not depend on cap rate compression at exit. Any compression that does occur is upside that wasn’t in the base case.
We purchase interest rate caps on all floating-rate debt. Rate caps provide insurance against the kind of interest rate shock that damaged many overleveraged deals in 2022–2024. The cost is a drag on returns — we accept it in exchange for certainty on our debt service obligations.
For context on how the capital stack and leverage interact in a complete deal structure, see our full guide to the four layers of financing in private real estate.
Frequently Asked Questions
What is leverage in real estate? Leverage in real estate is the use of borrowed capital (debt) to control a property worth more than your equity investment alone. It amplifies returns on equity when an asset appreciates or generates income above the cost of debt — and amplifies losses when it underperforms. The most common measure of leverage is LTV (loan-to-value), which expresses the loan as a percentage of the property’s value.
What is a good LTV for a real estate investment? A “good” LTV depends on the deal type, lender, and risk tolerance. For stabilized multifamily acquisitions using agency debt, 65%–75% LTV is standard and considered conservative to moderate. Bridge loans on value-add acquisitions often run 70%–80% LTV. Above 80%, the equity cushion shrinks meaningfully, and the deal becomes more sensitive to value declines, rate increases, and business plan delays.
What is positive vs. negative leverage in real estate? Positive leverage exists when the property’s cap rate exceeds the interest rate on the debt — meaning debt amplifies equity returns above the unlevered cash yield. Negative leverage exists when the cap rate is lower than the debt interest rate — meaning every dollar of debt actually reduces the equity investor’s cash return below the unlevered yield. The 2022–2024 rate environment pushed many deals into negative leverage territory as interest rates surged past prevailing cap rates.
What is DSCR and why does it matter? DSCR (Debt Service Coverage Ratio) is NOI divided by annual debt service. It measures how many times a property’s income covers its loan payments. A DSCR of 1.25x means the property generates 25% more income than required to service the debt — a standard institutional minimum. DSCR is critical because it tells you how much income can decline before the property can no longer cover its obligations.
How does leverage affect IRR in a real estate deal? Leverage amplifies IRR when the deal performs as projected, because equity investors earn returns on a larger asset base relative to their invested capital. A 20% appreciation on a $2M asset represents $400,000 of gain — credited entirely to the $700,000 of equity if the remaining $1.3M is debt. However, leverage also amplifies IRR in the downside scenario — losses also accrue entirely to equity while the lender’s claim remains fixed. See our guide to IRR in Real Estate for a full explanation.
What mistakes do investors make with leverage? The most common leverage mistakes are: (1) stacking too much debt through senior plus mezzanine layers that leave no equity cushion; (2) using floating-rate debt without an interest rate cap; (3) underwriting exit assumptions that depend on cap rate compression; (4) not stress-testing DSCR for rate increases; and (5) sizing debt against pro forma stabilized NOI rather than conservative in-place income at acquisition.
Disciplined Leverage Is the Difference Between Performance and Risk
Leverage is not the enemy of conservative investing — undisciplined leverage is. When sized appropriately, underwritten to current rates, and stress-tested against realistic downside scenarios, leverage is one of the most powerful tools available to real estate investors.
At Northwind Investment Group, leverage is not a dial we turn up to hit a return target. It is a structural decision made at the beginning of every underwriting process — one that shapes every subsequent assumption about cash flow, DSCR, exit flexibility, and downside protection.
If you want to see how this plays out in an actual deal structure, with full disclosure of LTV, DSCR, debt terms, and sensitivity analysis, our investor portal is the starting point.