
What is a good cap rate — and how do you use it to evaluate a multifamily investment? These are among the first questions serious investors ask, and the answers reveal more about a market, an asset, and a sponsor’s strategy than almost any other single metric. Cap rates are widely quoted but frequently misunderstood. This guide explains exactly what cap rates mean, how to read them by market and asset class, and what ranges Northwind targets when evaluating value-add multifamily deals.
What Is a Cap Rate?
A capitalization rate (cap rate) is a real estate valuation metric that expresses the relationship between a property’s net operating income (NOI) and its market value or purchase price. It answers a simple question: if you bought this property for all cash — no debt — what annual return would the income produce?
Cap rate is expressed as a percentage and calculated at a single point in time, based on current or stabilized income. It is one of the most widely used metrics for comparing multifamily properties across markets and asset classes.
The Cap Rate Formula
Cap Rate = Net Operating Income (NOI) ÷ Property Value (or Purchase Price)
Where:
- Net Operating Income (NOI) = total rental income minus all operating expenses (property management, insurance, taxes, maintenance, utilities, vacancy allowance) — but before debt service
- Property Value = the current market value or the purchase price you are evaluating
Example:
- A 40-unit apartment complex generates $420,000 in annual gross rents
- After operating expenses of $180,000, the NOI is $240,000
- The asking price is $3,200,000
- Cap Rate = $240,000 ÷ $3,200,000 = 7.5%
This means the property produces a 7.5% annual return on its purchase price before financing costs. If you paid all cash, your unlevered return would be 7.5%.
What Is a Good Cap Rate?
There is no single answer to what makes a cap rate “good” — it depends on the market, the asset class, the risk profile of the property, and the interest rate environment. However, there are widely accepted benchmarks that experienced multifamily investors use as reference points.
As a general rule: a lower cap rate signals a lower-risk, higher-demand asset in a competitive market. A higher cap rate signals a higher-yield asset that typically carries more risk, deferred maintenance, or a less liquid location. Neither is automatically better — what matters is whether the cap rate is appropriate for the risk you are taking on.
For multifamily real estate in 2024–2025, here is the broad context: as interest rates rose significantly between 2022 and 2024, cap rates also expanded across most markets after years of compression. This has created more attractive entry points for disciplined investors who can underwrite to current conditions rather than projecting a return to historically low cap rate environments.
Cap Rate Benchmarks by Market and Asset Class
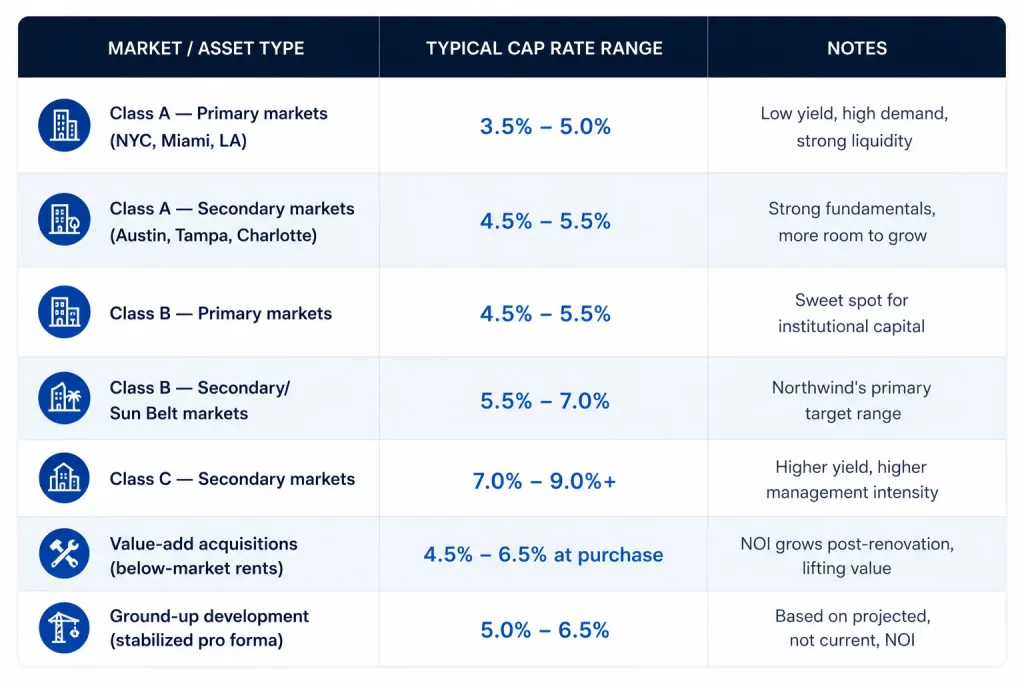
These ranges shift with interest rates, local supply and demand, and investor appetite. In markets with strong population growth and low housing supply — such as Florida and Texas — cap rates have historically been compressed compared to the national average, reflecting the premium investors pay for reliable rent growth.
The Inverse Relationship: What Cap Rate Movement Tells You
One of the most important concepts in real estate valuation is that cap rates and property values move in opposite directions.
- When cap rates compress (go down): Property values go up — the same NOI is worth more, because investors are willing to pay more for income in that market.
- When cap rates expand (go up): Property values go down — the same NOI is worth less, because investors demand a higher yield to compensate for risk or higher borrowing costs.
Example of cap rate compression: A property with $300,000 NOI is worth $5,000,000 at a 6.0% cap rate. If cap rates compress to 5.0% — common in high-growth markets over the 2015–2021 cycle — that same NOI makes the property worth $6,000,000. The owner gained $1,000,000 in value without changing the income at all.
Example of cap rate expansion: If cap rates expand from 5.5% to 6.5% — as happened across many Sun Belt markets in 2022–2023 — a $5,000,000 property (at 5.5% on $275,000 NOI) would reprice to approximately $4,230,000 at a 6.5% cap rate. That is a 15% value decline on the same income.
This is why cap rate risk — specifically, the exit cap rate assumption in a deal’s underwriting — is one of the most critical variables in any real estate return projection.
Cap Rate vs. Cash-on-Cash Return
Cap rate and cash-on-cash return are related but measure different things. Investors sometimes confuse them.
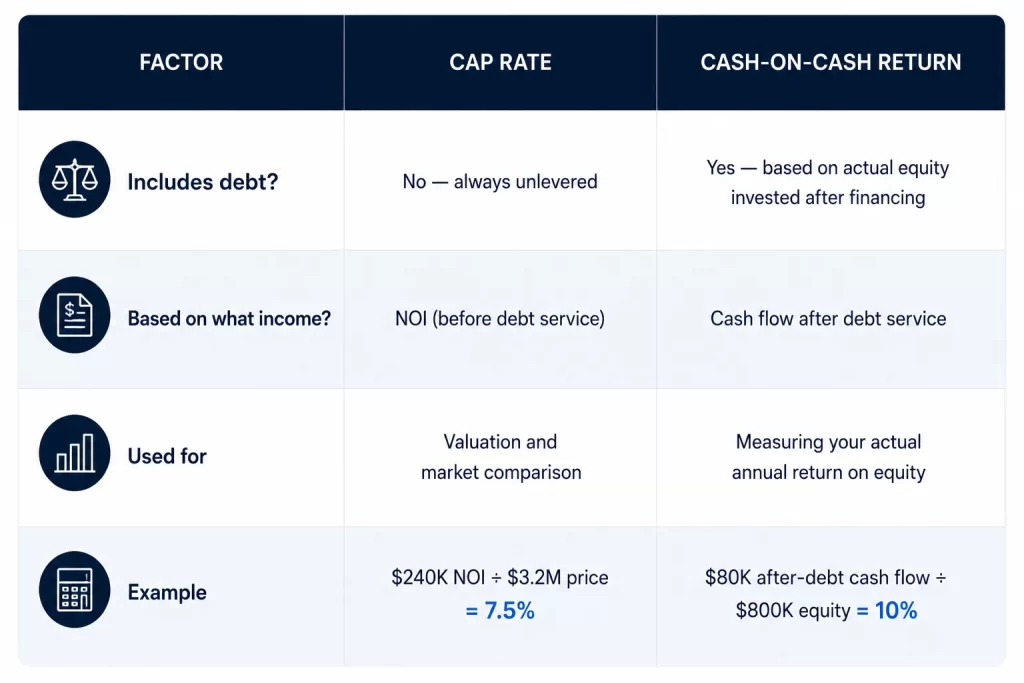
Cap rate is a property metric. Cash-on-cash is an investor metric. Both matter — cap rate tells you how the market prices the asset, and cash-on-cash tells you what you personally earn on the equity you put in.
How Sponsors Use Cap Rates to Build a Value-Add Business Plan
In a value-add multifamily deal, the cap rate at acquisition is not the cap rate at exit — and that spread is where investor returns are generated.
Here is how a typical value-add business plan works through the lens of cap rates:
At acquisition: A 48-unit Class B property is purchased at a 6.0% cap rate on in-place NOI of $288,000, for a purchase price of $4,800,000. Units are below market rent by $150–$200/month.
During the value-add period (Years 1–3): The sponsor renovates 40 of 48 units, upgrades common areas, improves management, and raises rents to market. NOI grows from $288,000 to $420,000 as occupancy stabilizes and rents increase.
At exit (Year 5): The property is sold at a 5.75% exit cap rate — slightly compressed from acquisition due to market appreciation and asset improvement. Sale price = $420,000 ÷ 0.0575 = $7,304,000.
The sponsor bought at $4,800,000 and sold at $7,304,000 — not by hoping the market moved, but by executing a disciplined plan to grow NOI. This is forced appreciation: creating value through operational performance, not speculation.
The exit cap rate is the single biggest assumption in any multifamily underwriting. Conservative sponsors assume an exit cap rate equal to or higher than the going-in cap rate. Aggressive sponsors project cap rate compression at exit. Ask every sponsor what they are assuming — and stress-test what happens to returns if the exit cap rate is 50 or 100 basis points higher than projected.
What Cap Rate Doesn’t Tell You
Cap rate is a valuable tool, but it has important limitations that every investor should understand before relying on it.
It is a snapshot, not a forecast. Cap rate reflects current or trailing NOI — it does not capture the rent growth potential, renovation upside, or market trajectory of a property. A 5.5% cap rate in a high-growth market with significant value-add potential may be far more attractive than a 7.5% cap rate in a stagnant market with no rent growth runway.
It ignores financing. Because cap rate is calculated before debt service, two deals with the same cap rate can produce very different returns depending on the loan terms. Interest rate, loan-to-value ratio, and amortization schedule all affect what you actually earn on your equity.
It can be manipulated. NOI is an input — and NOI can be overstated by understating expenses, projecting unrealistic occupancy, or excluding legitimate costs. Always review the expense load as a percentage of gross revenue (a well-run Class B multifamily property typically has an expense ratio of 40%–55%) and verify that the NOI used to calculate the cap rate reflects normalized, realistic operations.
It does not reflect asset quality. Two properties in the same city can trade at the same cap rate but have completely different physical conditions, tenant profiles, and capital expenditure requirements. Cap rate is a starting point for analysis, not a conclusion.
Frequently Asked Questions
What is a good cap rate for multifamily real estate? A good cap rate for multifamily real estate depends on the market and asset class. In high-growth Sun Belt markets, Class B value-add properties typically trade at cap rates of 5.5%–7.0% in current market conditions. A cap rate in this range represents a reasonable entry yield with meaningful value-add upside — particularly when the deal is financed with conservatively underwritten debt.
Is a higher cap rate always better? Not necessarily. A higher cap rate means higher income relative to purchase price — but it usually reflects higher risk. Class C properties in transitional neighborhoods trade at higher cap rates because they carry more management intensity, deferred maintenance, and tenant turnover. A disciplined investor evaluates cap rate alongside the risk profile of the asset, not in isolation.
What is the difference between a cap rate and an interest rate? A cap rate measures the income return on a property’s value. An interest rate measures the cost of debt. The spread between a property’s cap rate and the interest rate on its mortgage (called the cap rate spread) is a key indicator of deal feasibility. When cap rates are higher than interest rates — a positive leverage scenario — debt amplifies returns. When cap rates are lower than interest rates — negative leverage — debt erodes returns.
How does location affect cap rates? Location is one of the primary drivers of cap rates. High-demand, liquid markets with strong job growth and limited housing supply (Miami, Austin, Raleigh) command lower cap rates because investors accept lower initial yields in exchange for strong long-term appreciation and rent growth. Secondary and tertiary markets offer higher cap rates but typically with less liquidity and more income volatility.
What is a stabilized cap rate vs. a going-in cap rate? A going-in cap rate is based on the NOI of the property at the time of purchase — which may be below market if units are vacant or rents are below market. A stabilized cap rate is based on projected NOI once the value-add business plan is executed and the property is fully leased at market rents. Sponsors typically present both — and the gap between them represents the value-add opportunity.
How do rising interest rates affect cap rates? Rising interest rates generally put upward pressure on cap rates, because investors require higher yields to justify owning real estate over risk-free alternatives. Between 2022 and 2024, the rapid increase in the federal funds rate drove cap rate expansion across most property types. This created better entry-point pricing for buyers who could underwrite to current interest rates — and presented challenges for owners who needed to refinance or sell into a higher-rate environment.
See How Northwind Applies Cap Rate Analysis to Real Deals
Understanding cap rates in theory is useful. Seeing how they are applied in a specific market, on a specific asset, with conservative exit assumptions and transparent underwriting — that is where the real education happens.
At Northwind Investment Group, every investment summary we share with our investors includes the going-in cap rate, the stabilized cap rate, the projected exit cap rate, and the sensitivity analysis showing how returns change under multiple scenarios. We underwrite for performance, not for the best-case outcome.
- Explore active investment opportunities: portal.northwindig.com
- Learn about our multifamily strategy: northwindig.com/investment-strategy/why-multifamily
- Browse our investor glossary: northwindig.com/insights/glossary
- Speak with our team: (888) 842-0476
We don’t speculate. We underwrite for performance.